Published on 2025-06-29T19:54:47Z
What is Abandonment Rate? Understanding Drop-offs in Website Funnels
Abandonment Rate measures the percentage of visitors who start but do not complete a desired action on your website, such as signing up for a newsletter or completing a purchase.
It’s a critical indicator in CRO (Conversion Rate Optimization), UX (User Experience), and SEO (Search Engine Optimization) analyses because it highlights friction points that prevent conversions.
A high abandonment rate can signal issues like slow page load times, confusing navigation, or misaligned user expectations.
By tracking and reducing abandonment, businesses can improve user satisfaction, boost conversion rates, and increase revenue.
Tools like Prevue.me offer actionable critiques, pinpointing areas where visitors drop off and suggesting improvements for lead generation, accessibility, and overall UX.
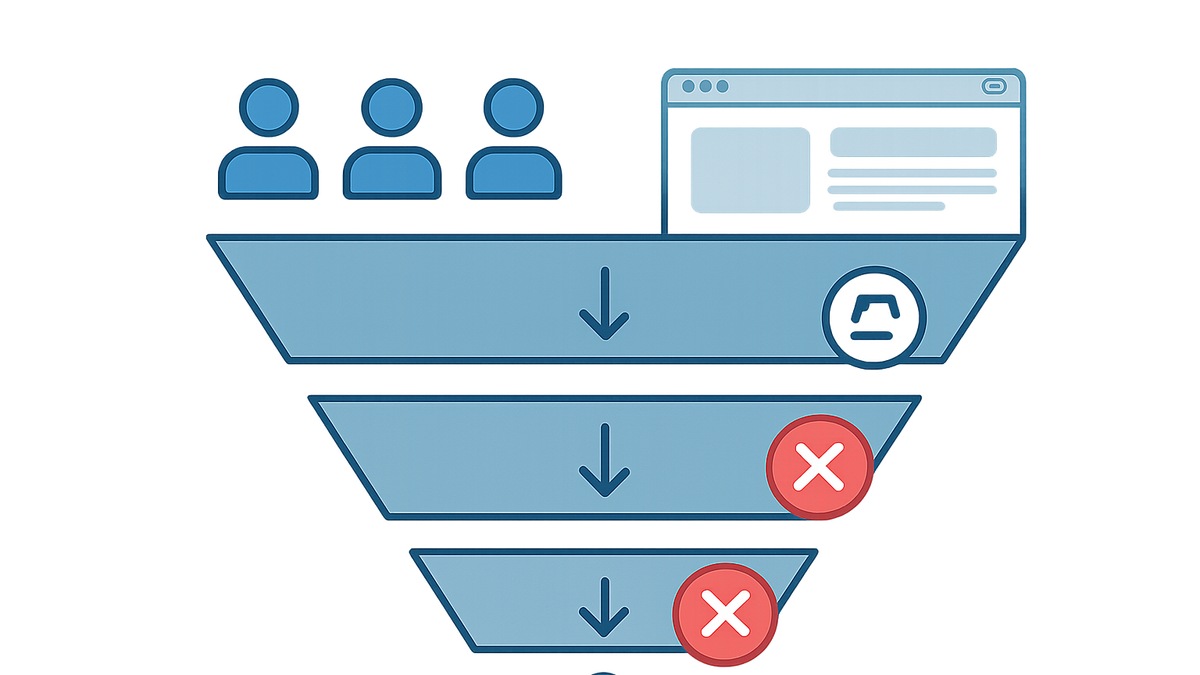
Abandonment rate
Percentage of visitors who leave before completing a desired action in a conversion funnel, critical for CRO, UX, and SEO.
Why Abandonment Rate Matters
Abandonment Rate provides insight into where and why users disengage before completing key actions.
Understanding this metric helps teams identify friction points that hinder conversions, informing data-driven improvements in design and content. By monitoring abandonment, businesses can prioritize optimizations that directly impact revenue and user satisfaction.
-
Impact on revenue
High abandonment means fewer successful conversions, directly reducing sales volume and ROI.
-
Seo and ux implications
Search engines factor in user engagement; high drop-offs can lower your search rankings and signal poor UX to visitors.
How to Calculate Abandonment Rate
Calculating abandonment rate involves comparing the number of users who exit before completion against those who started the process. This metric can be applied to single-step and multi-step funnels to pinpoint specific drop-off stages.
-
Single-step funnel
Calculated as ((Total Visitors – Completed Actions) / Total Visitors) × 100%. Ideal for simple forms or landing pages with one call-to-action.
-
Multi-step funnel
Measure drop-offs between steps: ((Users at Step N – Users at Step N+1) / Users at Step N) × 100%.
- Step example:
If 1,000 users start checkout and 700 complete payment, abandonment = (1000–700)/1000 × 100 = 30%.
- Step example:
Factors Influencing Abandonment Rate
Several factors can drive users to abandon a process, often revealing areas for optimization. By understanding these influences, teams can implement targeted fixes to improve completion rates.
-
Page load time
Slow loading pages frustrate users and increase the likelihood of exit, especially on mobile.
-
Usability & navigation
Complex forms, unclear labels, and poor navigation paths cause confusion and abandonment.
-
Misaligned expectations
Promises in ads or CTAs not reflected on landing pages undermine trust and trigger exits.
-
Mobile experience
Unresponsive designs and touch targets can make interactions cumbersome on mobile devices.
Strategies to Reduce Abandonment Rate
Implementing proven optimization tactics can significantly lower abandonment rates. Focus on speed, clarity, trust, and personalization to guide users smoothly through the funnel.
-
Optimize page load speed
Compress assets, leverage caching, and minimize HTTP requests to improve performance.
- Image compression:
Use modern formats (WebP) and tools to reduce file sizes without sacrificing quality.
- Lazy loading:
Defer offscreen images and resource-heavy elements until they’re needed.
- Image compression:
-
Simplify forms and checkout
Reduce the number of fields, use clear labels, and provide real-time validation to streamline the process.
- Autofill support:
Enable browser autofill to speed up form completion.
- Progress indicators:
Show step-by-step progress bars for multi-page forms.
- Autofill support:
-
Improve cta clarity
Use descriptive, action-oriented text and ensure buttons stand out visually.
-
Enhance trust signals
Display security badges, testimonials, and clear privacy policies to build confidence.
-
Personalization and targeting
Tailor content and offers based on user behavior, location, or past interactions.
Using SaaS Tools to Diagnose and Reduce Abandonment
Specialized tools can automate analysis, reveal hidden friction points, and suggest prioritized improvements. Integrating these platforms into your workflow accelerates optimization efforts.
-
Prevue.me actionable critiques
prevue.me evaluates your site’s CRO, UX, SEO, and accessibility, providing prioritized recommendations to reduce abandonment and boost lead generation.
-
Google analytics funnel reports
Built-in funnel visualization allows you to track where users drop off across goal paths.
-
Hotjar session recordings
Watch real user sessions to see exactly where visitors hesitate or abandon.
-
Optimizely a/b testing
Experiment with different page variations to determine which changes reduce abandonment.