Published on 2025-06-29T21:50:07Z
What are Engagement Metrics? Examples and Best Practices
Engagement metrics are quantitative measures that show how users interact with a website, capturing actions like page views, clicks, scrolls, and form submissions.
In CRO, UX, and SEO, these metrics are vital for identifying performance bottlenecks and validating design and content optimizations. Common examples include bounce rate, session duration, pages per session, scroll depth, click-through rate, and conversion events. Search engines like Google consider engagement signals such as dwell time and bounce rate when evaluating page quality and ranking. Tools like Prevue.me provide automated audits and actionable critiques, combining engagement insights with prioritized recommendations to boost lead generation, enhance user experience, and drive continuous improvement.
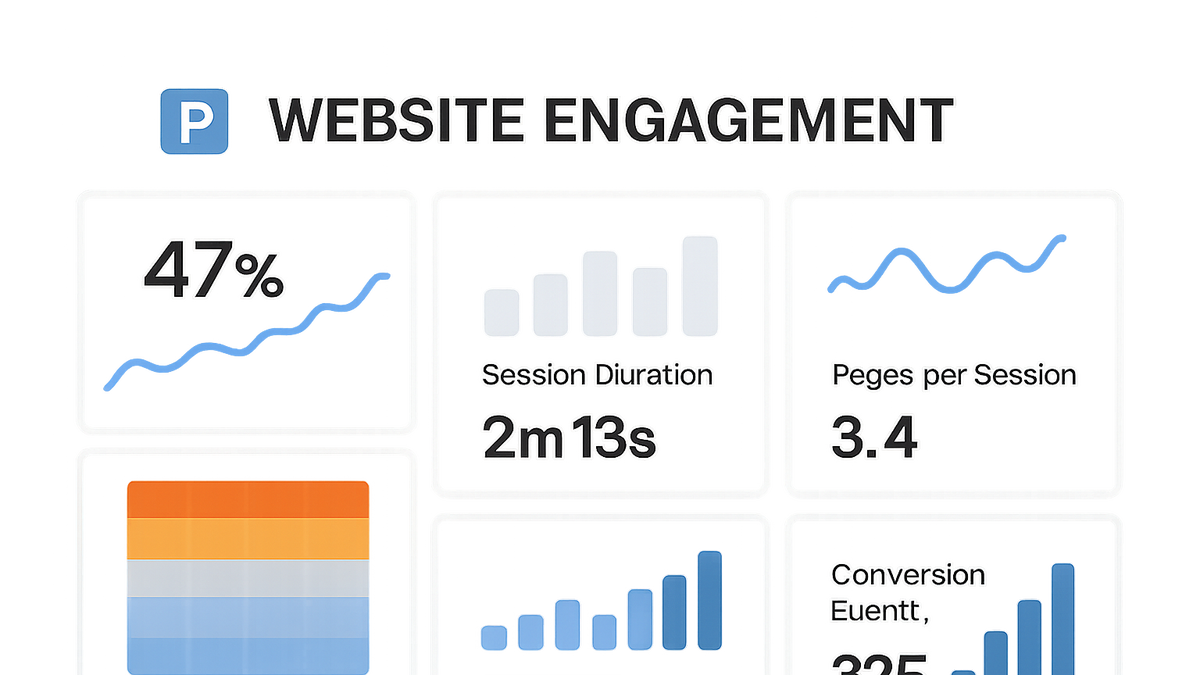
Engagement metrics
Metrics like bounce rate, session duration, pages per session, scroll depth, and conversions measure user interaction for CRO, UX, and SEO success.
Why Engagement Metrics Matter
Engagement metrics provide crucial insights into how users interact with your website, revealing areas for improvement in CRO, UX, and SEO.
-
Driving conversion optimization
Engaged visitors are more likely to complete desired actions like purchases or form submissions, making engagement metrics a cornerstone of CRO strategies.
-
Enhancing user experience
By analyzing metrics such as session duration and scroll depth, you can identify usability issues and design elements that resonate with your audience.
-
Improving seo performance
Search engines use engagement signals like dwell time and bounce rate to assess content relevance and quality, impacting organic rankings.
-
Impact on lead generation
High engagement increases the likelihood of visitors engaging with lead magnets, filling out forms, and ultimately becoming customers.
Key Engagement Metrics Explained
Several core metrics help quantify user engagement. Understanding their definitions and implications is vital for targeted improvements.
-
Bounce rate
The percentage of single-page sessions where users leave without interacting further. A high bounce rate may indicate irrelevant content or poor UX.
-
Session duration
The average time users spend on your site per visit. Longer sessions often correlate with high-quality content and intuitive navigation.
-
Pages per session
The average number of pages viewed during a session. More pages per session suggest deeper engagement and content relevance.
-
Scroll depth
Tracks how far users scroll down a page, indicating content consumption levels and whether important information is seen.
-
Click-through rate (ctr)
The ratio of clicks on internal links or CTAs to total page views, reflecting how compelling your calls to action are.
-
Conversion events
Custom actions tracked as micro- or macro-conversions, such as form submissions, video plays, or downloads.
Measuring Engagement Metrics
To capture and analyze engagement data, a combination of analytics and user behavior tools is typically used.
-
Google analytics
Provides standard engagement metrics like bounce rate, session duration, and pages per session, with customizable dashboards and segments.
-
Heatmap and session replay tools
Tools like Hotjar and Crazy Egg visualize clicks, taps, and scroll behavior to uncover UX issues.
-
Prevue.me
Offers automated website audits with prioritized engagement critiques, combining CRO, SEO, UX, and accessibility insights in one report.
-
Accessibility checkers
Ensuring your site meets accessibility standards can improve engagement among users with disabilities, often tracked via specialized audit tools.
Using Prevue.me for Engagement Analysis
prevue.me streamlines the process of diagnosing engagement issues and implementing high-impact optimizations.
-
Automated engagement audits
Run in-depth audits that highlight bottlenecks in user flow, such as high-exit pages or low-scroll segments.
-
Actionable prioritized critiques
Receive a ranked list of recommendations to improve metrics like bounce rate and session duration, focusing effort where it matters most.
-
Integration with google analytics
Seamlessly import analytics data for a more comprehensive view of user interactions and performance trends.
-
Customizable reporting
Generate shareable reports and dashboards tailored to stakeholder needs, tracking progress over time.
Best Practices to Improve Engagement Metrics
Optimizing engagement is an ongoing process that combines technical, content, and design improvements.
-
Optimize page load speed
Use techniques like image compression, caching, and code minification to reduce load times and lower bounce rates.
-
Refine content structure
Use clear headings, bullet lists, and concise paragraphs to make content scannable and engaging.
-
Enhance calls to action
Design prominent, contextually relevant CTAs and test variations to increase click-through and conversion rates.
-
Improve mobile experience
Ensure responsive design and touch-friendly elements, as mobile users often have different engagement behaviors.
-
Incorporate interactive elements
Add tools like chatbots, quizzes, or sliders to increase user involvement and time on site.
-
Monitor, test, and iterate
Continuously track metrics with analytics tools and prevue.me, run A/B tests, and refine strategies based on data.