Published on 2025-06-29T20:08:32Z
What is a Feature Comparison Table? Examples in CRO, UX & SEO
Feature Comparison Table is a structured matrix that lists product or service features side by side to help users quickly evaluate options. In the context of website audits focusing on conversion rate optimization (CRO), user experience (UX), and search engine optimization (SEO), these tables serve as powerful tools to communicate value propositions and differentiate solutions. By clearly highlighting available features, benefits, and pricing details, Feature Comparison Tables guide prospects toward informed decisions and can significantly boost engagement metrics. When optimized for SEO with structured data and responsive design, they also enhance search visibility and mobile usability. Tools like Prevue.me leverage actionable critiques to populate and update these tables, ensuring maximum lead generation through transparency and clarity.
Beyond listing features, effective tables incorporate visual indicators, accessibility best practices, and strategic column ordering to improve scannability. They often appear on pricing pages, landing pages, and product pages, acting as decision accelerators. By adhering to UX principles—such as responsive layouts, legible typography, and accessible markup—these tables avoid common pitfalls like information overload and poor mobile performance. SEO enhancements, like schema.org markup, further amplify their impact by generating rich snippets in search results, driving organic traffic.
Feature comparison table
Tabular comparison of features to guide user decisions, optimize UX/CRO, and enhance SEO.
Definition and Purpose
A Feature Comparison Table (FCT) is a side-by-side matrix that catalogs features, specifications, or benefits of multiple products or services. It clarifies distinctions between options and simplifies decision-making for users. In website audits, FCTs help highlight competitive advantages and guide visitors toward the optimal solution. They also serve as a foundation for CRO experiments by identifying which features resonate most with the audience.
-
What is a feature comparison table?
A structured layout that displays features in rows and products or versions in columns, enabling quick, at-a-glance comparisons.
-
Primary goals
Enhance transparency, foster trust, and accelerate the buyer journey by making feature differentiation obvious and accessible.
Importance in CRO, UX, and SEO
Feature Comparison Tables intersect with CRO, UX, and SEO by improving clarity, engagement, and search performance. Well-designed tables can reduce bounce rates, increase time on page, and target relevant keywords. They also contribute to a positive user experience by presenting information in a digestible format.
-
Boosting conversions
By clearly contrasting key features and pricing, users can swiftly identify the best fit, leading to higher conversion rates.
-
Enhancing usability
Scannable rows, consistent headings, and visual markers (e.g., checkmarks) improve content digestibility and overall UX.
-
Seo benefits
Implementing table and schema markup helps search engines parse content, potentially generating rich snippets and improving keyword relevance.
Key Components of an Effective Feature Comparison Table
To maximize impact, tables must balance detail with simplicity. Core components include clear labels, logical layout, and intuitive visual cues.
-
Clear feature labels
Use concise, descriptive terms for each feature, avoiding jargon to ensure all prospects understand the comparison.
-
Logical column layout
Order columns by relevance or pricing tier, placing the recommended or most profitable option in a prominent position.
-
Visual indicators
Incorporate checkmarks, crosses, icons, or color coding to highlight feature availability and draw attention.
- Use of icons:
Standardize icons (✔️, ❌) and maintain consistent sizing and color for quick recognition.
- Text alternatives:
Provide visible labels and aria-text for screen readers to ensure accessibility compliance.
- Use of icons:
Design and SEO Best Practices
Combining UX design principles with SEO optimization ensures tables perform well across devices and in search results.
-
Mobile responsiveness
Implement fluid grids or horizontal scrolling to maintain readability on smaller screens.
-
Structured data markup
Incorporate structured data to generate rich snippets in search results. For example:
<table itemscope itemtype='https://schema.org/ItemList'> <tr itemprop='itemListElement' itemscope itemtype='https://schema.org/Product'> <td itemprop='name'>Actionable Critiques</td> <td itemprop='offers' itemscope itemtype='https://schema.org/Offer'> <span itemprop='priceCurrency' content='USD'>$</span><span itemprop='price' content='0'>0</span> </td> </tr> </table> -
Performance optimization
Minimize CSS and JavaScript, use semantic HTML, and lazy load off-screen content to keep page speed high.
Real-World Examples
Many SaaS websites leverage Feature Comparison Tables on pricing and product pages. Below are two illustrative cases.
-
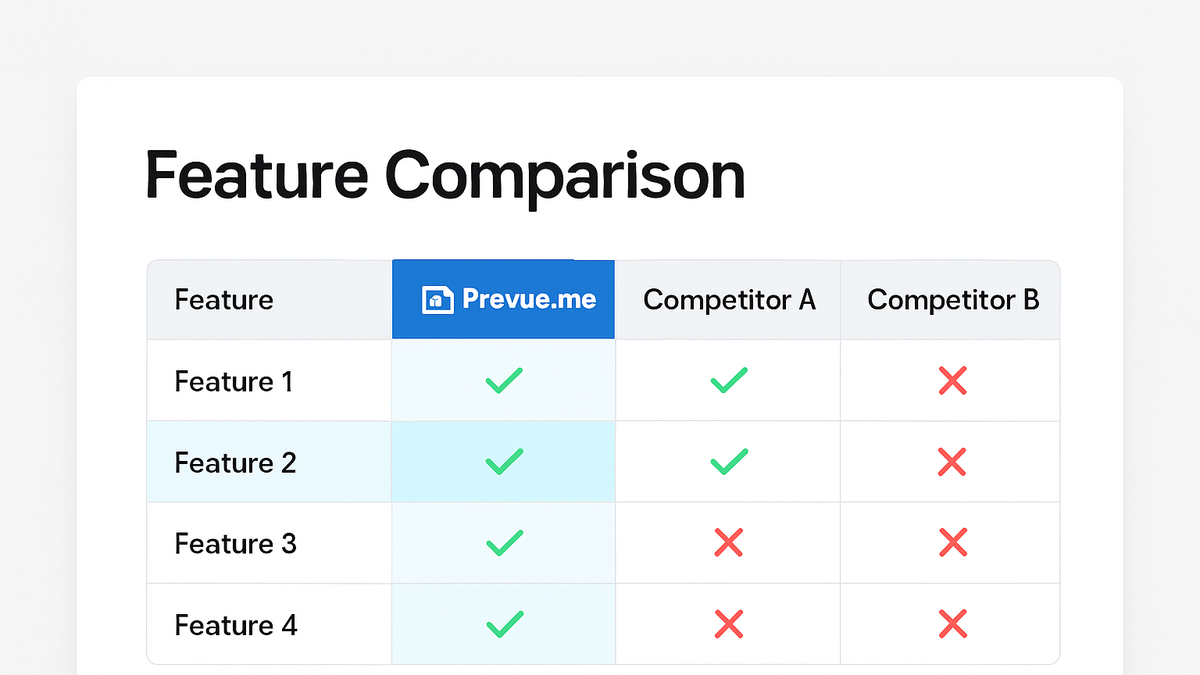
Prevue.me feature comparison
prevue.me showcases its CRO, lead generation, SEO, UX, and accessibility critique features side by side with competitors, emphasizing actionable insights.
-
Pricing page matrix
Common on SaaS pricing pages, these tables compare subscription tiers, add-on features, and support levels to streamline plan selection.
Common Pitfalls and How to Avoid Them
Even well-intentioned tables can hinder decision-making if mistakes occur. Recognizing these pitfalls helps maintain effectiveness.
-
Information overload
Listing too many features or overly detailed specs can overwhelm users; focus on differentiators that matter most.
-
Ignoring accessibility
Poor contrast ratios, missing ARIA labels, and lack of keyboard navigation exclude users with disabilities.
-
Static, non-interactive tables
Without filters or sorting options, tables may frustrate users seeking personalized comparisons.