Published on 2025-06-29T19:16:35Z
What is a Heatmap? Examples for CRO/UX/SEO
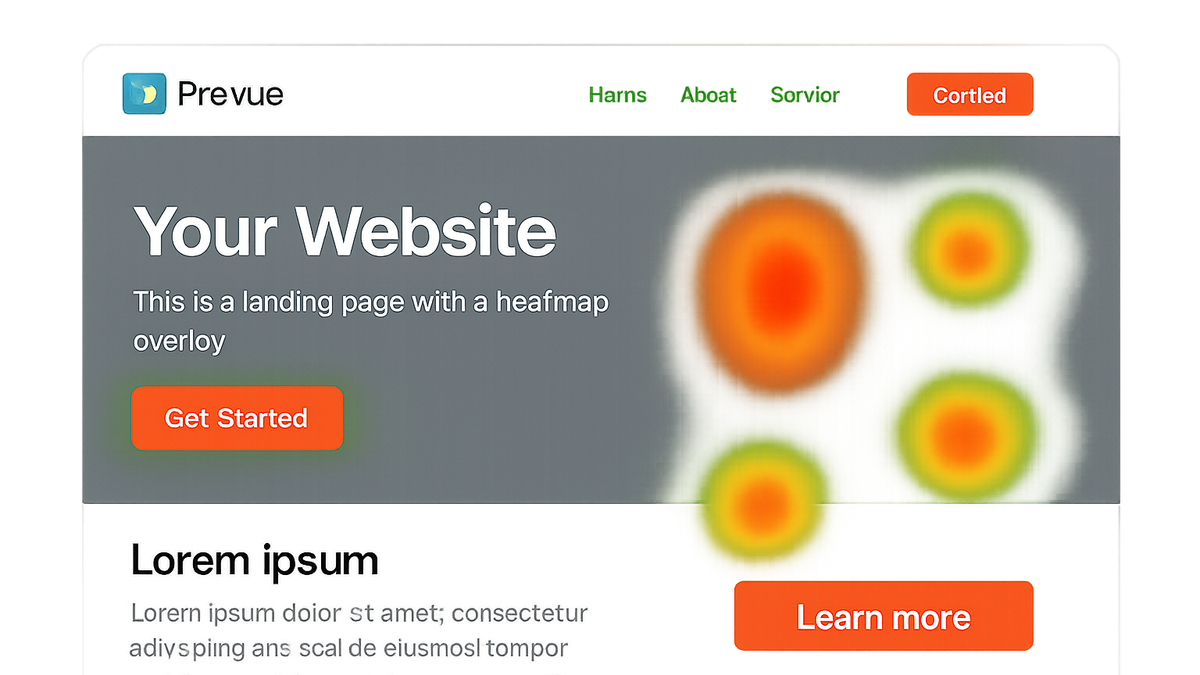
Heatmaps are powerful visualization tools that overlay user behavior data directly onto web pages using color gradients. In the context of website critique for CRO, UX, and SEO, they reveal where visitors click, how far they scroll, and where their cursors hover. This information helps teams identify friction points, optimize call-to-action placements, and improve overall engagement—key factors for boosting conversions and search rankings. Prevue.me, for instance, captures these interactions and pairs them with AI-driven critiques to deliver targeted recommendations for lead generation, accessibility, and performance. By highlighting “hot” and “cold” zones, heatmaps guide data-driven changes to layout, content, and navigation. This glossary article explores heatmap types, implementation steps, analysis techniques, and a real-world Prevue.me example.
Heatmap
A heatmap visualizes user interactions on a webpage, revealing click, scroll, and movement patterns to optimize CRO, UX, and SEO.
Overview of Heatmaps
Heatmaps provide a color-coded layer over webpages to illustrate areas of high and low user interaction. They convert raw behavioral data into intuitive visuals that inform design and optimization decisions.
-
Purpose of heatmaps
Heatmaps visually represent user behaviors by using color gradients to indicate areas of high and low interaction. They help teams quickly identify which parts of a page gain attention and which are overlooked.
-
Key benefits
Heatmaps support data-driven decisions in CRO, UX, and SEO by revealing patterns that guide optimization strategies.
- Conversion rate optimization:
Identify underperforming CTAs and adjust placement or design to boost conversions.
- User experience:
Understand navigation friction and content engagement to refine layout.
- Seo implications:
Improve user dwell time and reduce bounce rates through better content positioning.
- Conversion rate optimization:
Types of Heatmaps
Different heatmap types capture specific user interactions. Selecting the right type depends on the insights you need.
-
Click heatmaps
Show where users click, revealing popular buttons, links, and CTAs. Useful for optimizing interactive elements.
- Use case:
Test if users click the main CTA button and adjust design if needed.
- Data interpretation:
Red areas indicate high click density, blue areas low or no clicks.
- Use case:
-
Scroll heatmaps
Illustrate how far users scroll down a page. Helps assess content depth and above-the-fold impact.
- Use case:
Determine if important content is visible to most visitors.
- Data interpretation:
Areas where color fades indicate drop-off points.
- Use case:
-
Mouse movement heatmaps
Track cursor movement and hovers to infer attention. Linked to eye-tracking insights.
- Use case:
Identify engaging content or distractions.
- Data interpretation:
Clusters show points of interest or confusion.
- Use case:
Implementing Heatmaps on Your Website
Setting up heatmaps involves choosing a tool, embedding tracking code, and configuring your sessions to collect usable data.
-
Selecting a heatmap tool
Evaluate tools like prevue.me, Hotjar, Crazy Egg based on features such as session recording, segmentation, and integration with CRO workflows.
- Prevue.me:
Provides both heatmap analysis and automated critiques for CRO, lead generation, SEO, UX, and accessibility.
- Hotjar:
Offers heatmaps, session recordings, and feedback polls.
- Crazy egg:
Known for robust click and scroll maps with A/B testing integration.
- Prevue.me:
-
Installing tracking code
Add a small JavaScript snippet to your website’s header or through a tag manager to start data collection.
- Tag manager integration:
Use Google Tag Manager to deploy without touching code.
- Direct embed:
Paste the script directly into your site’s HTML.
- Tag manager integration:
-
Configuring sessions and segments
Define which pages to track, set time frames, and segment users by device, traffic source, or behavior to gain focused insights.
- Page selection:
Choose high-traffic or conversion-critical pages.
- User segmentation:
Segment by new vs returning users, geography, or campaign source.
- Page selection:
Analyzing Heatmap Data
Extract actionable insights by interpreting heatmap patterns, correlating with analytics, and prioritizing changes that align with business goals.
-
Identifying high- and low-engagement zones
Compare popular areas with under-engaged sections to uncover opportunities and bottlenecks.
- Adjusting calls-to-action:
Move CTAs into high-engagement zones to increase click-through.
- Content reorganization:
Relocate key messages to areas that receive more attention.
- Adjusting calls-to-action:
-
Correlating with analytics metrics
Combine heatmap insights with quantitative metrics like bounce rate, time on page, and conversion funnels.
- Bounce rate analysis:
If a high bounce rate aligns with low scroll depth, consider restructuring content.
- Conversion funnel alignment:
Ensure users click through steps as intended by refining navigation paths.
- Bounce rate analysis:
-
Prioritizing optimization efforts
Focus on changes that promise the highest impact with the lowest effort, guided by data-driven heatmap findings.
- Quick wins:
Small layout tweaks like button color or position.
- Long-term strategies:
In-depth UX redesigns based on holistic behavior patterns.
- Quick wins:
Real-World Application: Prevue.me Example
See how prevue.me leverages heatmap data to generate comprehensive critiques for conversion and user experience improvements.
-
Generating heatmap reports with prevue.me
prevue.me automatically captures heatmap data and compiles visual reports highlighting key engagement insights.
- Setup in minutes:
After adding the prevue.me script, reports refresh daily.
- Customizable dashboards:
Filter by page, device, and user segments.
- Setup in minutes:
-
Automated cro and ux critiques
Combine heatmap insights with AI-driven recommendations to optimize lead generation forms, CTAs, and page layouts.
- Form placement optimization:
Real-time suggestions to move forms into high-visibility zones.
- Cta effectiveness:
Recommend color, text, and position changes to boost click rates.
- Form placement optimization:
-
Integrating seo and accessibility insights
prevue.me also flags SEO and accessibility issues revealed by heatmap behavior, such as overlooked alt text or poor mobile layout.
- Seo recommendations:
Suggest repositioning content and links to improve dwell time.
- Accessibility tips:
Highlight elements that need contrast adjustments or larger touch targets.
- Seo recommendations: