Published on 2025-06-29T19:58:57Z
What is a KPI? Key Performance Indicator in CRO, UX, and SEO
In the context of website optimization for conversion rate optimization (CRO), user experience (UX), and
search engine optimization (SEO), a Key Performance Indicator (KPI) is a quantifiable measure used to
evaluate the success of various digital initiatives. By defining clear KPIs, teams can track progress
towards strategic goals such as increasing lead generation, improving site usability, and boosting organic
search traffic. KPIs offer a focused lens through which to interpret complex data, enabling data-driven
decisions and prioritizing optimization efforts that deliver measurable business outcomes. Regularly
reviewing KPIs helps identify performance trends, validate hypotheses, and guide iterative improvements in
design, content, and marketing strategies. Tools like Google Analytics and Prevue.me can
streamline KPI tracking by providing real-time insights, actionable critiques, and visualization
capabilities.
Kpi (key performance indicator)
A KPI is a measurable metric that tracks website performance against CRO, UX, and SEO goals, guiding data-driven optimization.
Understanding KPIs
In this section, we define what a Key Performance Indicator (KPI) is and explain why it’s critical for measuring and improving website performance across conversion rate optimization (CRO), user experience (UX), and search engine optimization (SEO).
-
What is a kpi?
A Key Performance Indicator (KPI) is a measurable value that demonstrates how effectively a website achieves key business objectives such as conversions, user engagement, or search visibility. KPIs provide quantifiable benchmarks to assess the success of digital strategies.
-
Why kpis matter
KPIs align teams on goals, inform data-driven decisions, and highlight areas for improvement in CRO, UX, and SEO efforts. They act as a compass guiding optimization initiatives toward measurable impact.
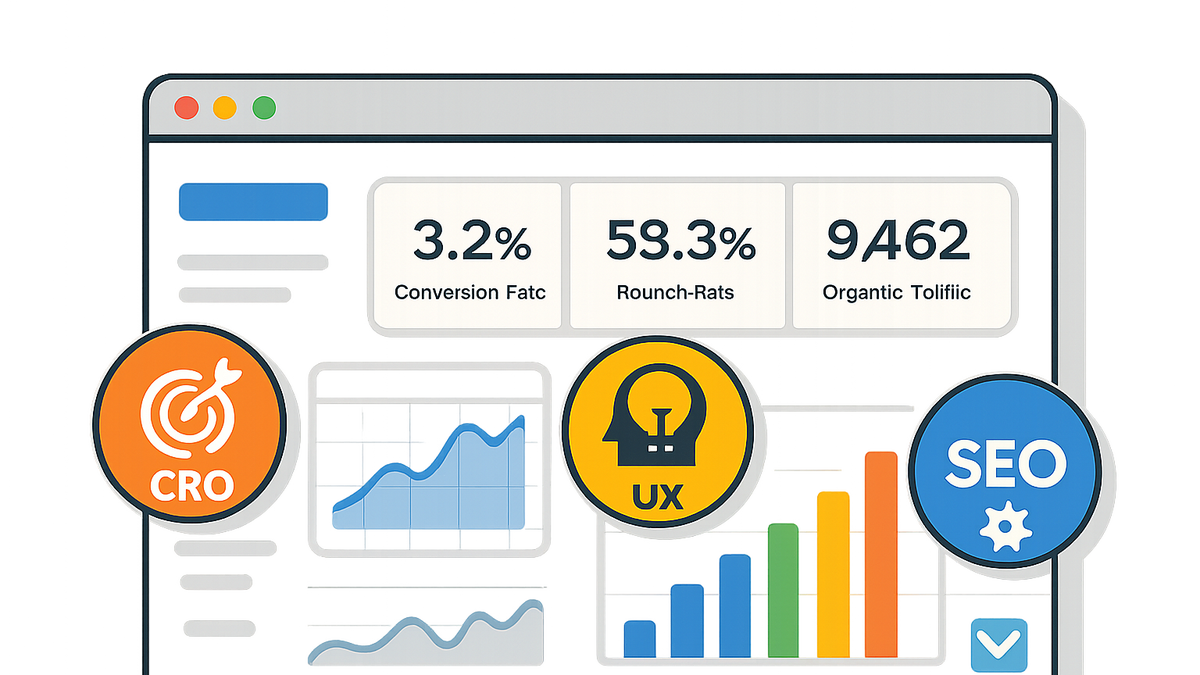
Types of Website KPIs
Explore the most relevant KPIs for website optimization in CRO, UX, and SEO. Each metric offers unique insights into user behavior and business performance.
-
Conversion rate
The percentage of visitors who complete a desired action (e.g., form submission or purchase). A primary CRO metric indicating how effectively your site turns visitors into leads or customers.
-
Bounce rate
The percentage of single-page sessions where users leave without interacting further. A high bounce rate may signal poor UX or misaligned content.
-
Average session duration
The average time users spend on your site during a visit. Longer sessions often reflect engaging content and positive UX.
-
Organic search traffic
The number of visitors arriving via unpaid search results. A core SEO KPI showing your site’s visibility and relevance in search engines.
-
Lead generation rate
The ratio of website visitors who become leads (e.g., by filling out a contact form). Critical for measuring the effectiveness of marketing and UX in driving business growth.
Setting SMART KPIs
Adopt the SMART criteria (Specific, Measurable, Achievable, Relevant, Time-bound) to ensure KPIs are realistic and actionable. SMART KPIs help maintain focus and clarity.
-
Specific
Define clear, unambiguous goals (e.g., increase form submissions by 15%). Specificity ensures everyone understands the target.
-
Measurable
Ensure that goals can be quantified or tracked through analytics tools. Measurability allows you to monitor progress objectively.
-
Achievable
Set realistic targets based on historical data and resources. Achievable KPIs prevent team burnout and maintain morale.
-
Relevant
Align KPIs with broader business objectives, such as revenue growth or customer satisfaction. Relevance guarantees that effort supports strategic priorities.
-
Time-bound
Assign deadlines or review dates to each KPI. Time constraints foster accountability and help pace optimization efforts.
Tracking and Analyzing KPIs
Learn how to monitor and analyze KPIs using specialized tools and dashboards. Effective tracking reveals trends, validates hypotheses, and supports continuous improvement.
-
Tools and dashboards
Leverage analytics platforms to aggregate data and visualize KPI trends. Integrating tools can streamline reporting and provide real-time insights.
- Google analytics:
A free web analytics service offering in-depth traffic and user behavior data. Ideal for tracking sessions, user flow, and goal completions.
- Prevue.me:
A CRO, UX, SEO, and accessibility critique platform that offers actionable recommendations for maximizing lead generation. Use
prevue.meto identify high-impact opportunities and monitor KPI improvements.
- Google analytics:
-
Reporting and visualization
Use charts, custom reports, and dashboards to communicate KPI performance to stakeholders. Visualizations make complex data more accessible and drive consensus.
-
Continuous optimization
Iterate on strategies based on KPI performance. Regularly test hypotheses, implement changes, and measure the impact to foster a culture of data-driven optimization.
Best Practices and Common Pitfalls
Adopt best practices to ensure meaningful KPI tracking and avoid common mistakes that can skew insights or derail optimization efforts.
-
Avoiding vanity metrics
Steer clear of metrics that look good but lack business impact (e.g., page views without conversion context). Focus on metrics tied to objectives.
-
Aligning kpis with customer journey
Select KPIs that reflect each stage of the customer journey—from awareness to purchase—to get a holistic view of performance.
-
Regular review and adaptation
Schedule periodic KPI reviews to retire outdated metrics and introduce new ones as business goals evolve.