Published on 2025-06-29T19:16:03Z
What is Page Speed Insights?
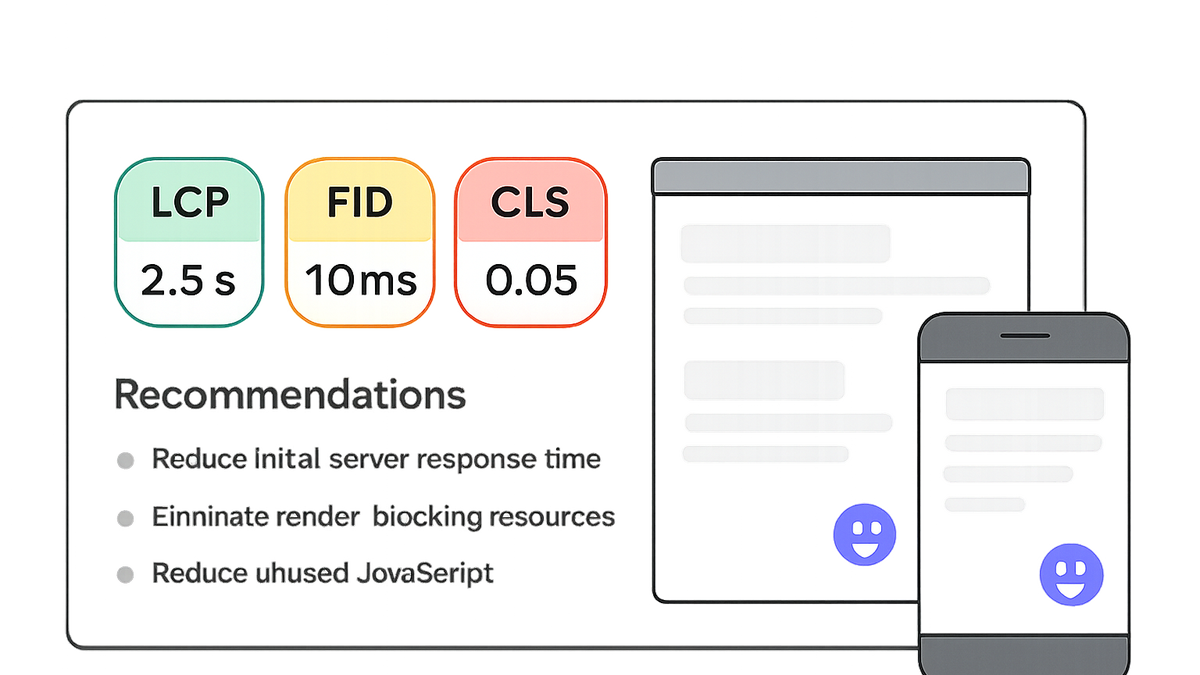
Page Speed Insights is a free tool provided by Google that evaluates the performance of a webpage across desktop and mobile devices. It measures both field data (real user metrics from the Chrome User Experience Report) and lab data (simulated performance metrics in a controlled environment), offering a comprehensive view of site speed.
The report breaks down key metrics such as Largest Contentful Paint (LCP), First Input Delay (FID), and Cumulative Layout Shift (CLS) to pinpoint areas for improvement. For professionals focused on Conversion Rate Optimization (CRO), User Experience (UX), and Search Engine Optimization (SEO), these insights are invaluable for prioritizing performance fixes that boost page load times, decrease bounce rates, and improve search rankings.
When combined with specialized SaaS platforms like Prevue.me, teams can translate these raw metrics into actionable critiques and track the impact of speed optimizations on lead generation, accessibility, and overall site health.
Page speed insights
Google's Page Speed Insights tool analyzes page performance using real and lab data, highlighting metrics like LCP, FID, and CLS for UX, SEO & CRO.
Why Page Speed Insights Matters
This section explores the critical role of Page Speed Insights in evaluating and improving website performance, impacting SEO rankings, user experience, and conversion rates.
-
Seo impact
Faster loading pages tend to rank higher in search engine results, as Google considers page speed a ranking factor. Page Speed Insights helps identify performance bottlenecks that, once resolved, can improve crawl efficiency and search visibility.
- Crawl budget:
Efficiently loading pages allow search engine bots to crawl more content within their allotted budget, ensuring better index coverage.
- Search rankings:
Google has confirmed that Core Web Vitals metrics influence page rankings, making speed optimizations crucial for SEO.
- Crawl budget:
-
User experience
Page speed directly affects user satisfaction: slow pages lead to higher bounce rates and frustration. Insights from the tool guide UX enhancements to create faster, more responsive interactions.
- Perceived performance:
Improving metrics like LCP and FID enhances the user’s perception of speed, making a site feel more responsive.
- Accessibility:
Optimized load times also benefit users on assistive technologies, improving overall accessibility compliance.
- Perceived performance:
-
Conversion rate optimization
Every millisecond counts: faster pages can lead to higher engagement and conversion rates. Page Speed Insights pinpoints elements slowing down key conversion paths.
- Form submission:
Reducing input delays ensures forms load and submit quickly, minimizing drop-offs during critical user interactions.
- Checkout flows:
Optimized script loading speeds up checkout pages, lowering cart abandonment rates.
- Form submission:
-
Integration with prevue.me
prevue.me can ingest Page Speed Insights data to generate prioritized, actionable recommendations for CRO, UX, SEO, and accessibility, giving teams a single dashboard for critiques and improvements.
How Page Speed Insights Works
An overview of the methodology behind Page Speed Insights, detailing the sources of data, testing environments, and metric calculations used to generate performance scores.
-
Lab data
Simulated performance metrics run in a controlled environment using Google Lighthouse. It provides reproducible results for debugging and iterative testing.
- Device emulation:
Tests run on a simulated mid-tier mobile device to mirror common user hardware.
- Network throttling:
Applies standardized CPU and network slowdowns to emulate real-world mobile conditions.
- Device emulation:
-
Field data
Real user performance data aggregated from the Chrome User Experience Report, reflecting actual user experiences over time.
- Chrome ux report:
A public dataset of real-world performance metrics collected from opted-in users of the Chrome browser.
- Privacy threshold:
Data points are only reported when enough samples exist to protect user privacy.
- Chrome ux report:
Understanding Scores and Metrics
This section dives into the scoring system and key metrics reported by Page Speed Insights, explaining how to interpret scores, opportunities, diagnostics, and passed audits.
-
Score categories
Overall performance score ranges categorize pages as fast, moderate, or slow, guiding priority decisions.
- Fast (90–100):
Pages in this range deliver excellent user experiences with minimal delays.
- Moderate (50–89):
Pages may require optimizations; further improvements can yield significant gains.
- Slow (0–49):
Pages need critical performance fixes to meet user and SEO expectations.
- Fast (90–100):
-
Opportunities
Recommendations that can reduce page load time, such as eliminating render-blocking resources and optimizing image formats. Each opportunity estimates potential savings in milliseconds.
- Image optimization:
Serve images in next-gen formats like WebP to decrease file sizes.
- Render-blocking resources:
Defer or asynchronously load CSS and JavaScript to improve render time.
- Image optimization:
-
Diagnostics
Additional suggestions for improving performance, focusing on best practices for efficient code and resource loading.
- Time to interactive:
Measures how quickly a page becomes fully interactive.
- Total blocking time:
Quantifies the total amount of time the main thread is blocked.
- Time to interactive:
-
Passed audits
Audits where your page meets or exceeds performance best practices. Keeping these green ensures baseline performance standards.
Optimization Best Practices
Guidelines and techniques for addressing Page Speed Insights recommendations, ensuring real-world improvements in site performance and user satisfaction.
-
Optimize images
Compress images without quality loss, use responsive image sizes, and leverage lazy loading for offscreen content.
-
Minify resources
Remove whitespace and comments from CSS, JavaScript, and HTML to reduce file sizes and improve parse times.
-
Leverage browser caching
Set appropriate cache headers for static assets to decrease repeat load times for returning visitors.
-
Preconnect and prefetch
Use resource hints to establish early connections and preload critical assets, reducing latency.
Integrating Prevue.me for Actionable Insights
A look at how prevue.me can enhance the Page Speed Insights process, turning metrics into prioritized action items and tracking the impact of optimizations.
-
Automated site scans
prevue.me runs regular audits using Page Speed Insights data, combined with CRO, UX, and accessibility heuristics for comprehensive critiques.
-
Prioritized recommendations
The platform ranks issues by potential impact on lead generation, SEO, and conversion rates, helping teams focus on the most critical fixes first.
-
Reporting and monitoring
Track historical performance, visualize improvements over time, and correlate speed optimizations with business metrics such as bounce rate and conversion rate.