Published on 2025-06-29T19:48:38Z
What is Web Analytics? Examples from CRO, UX, and SEO
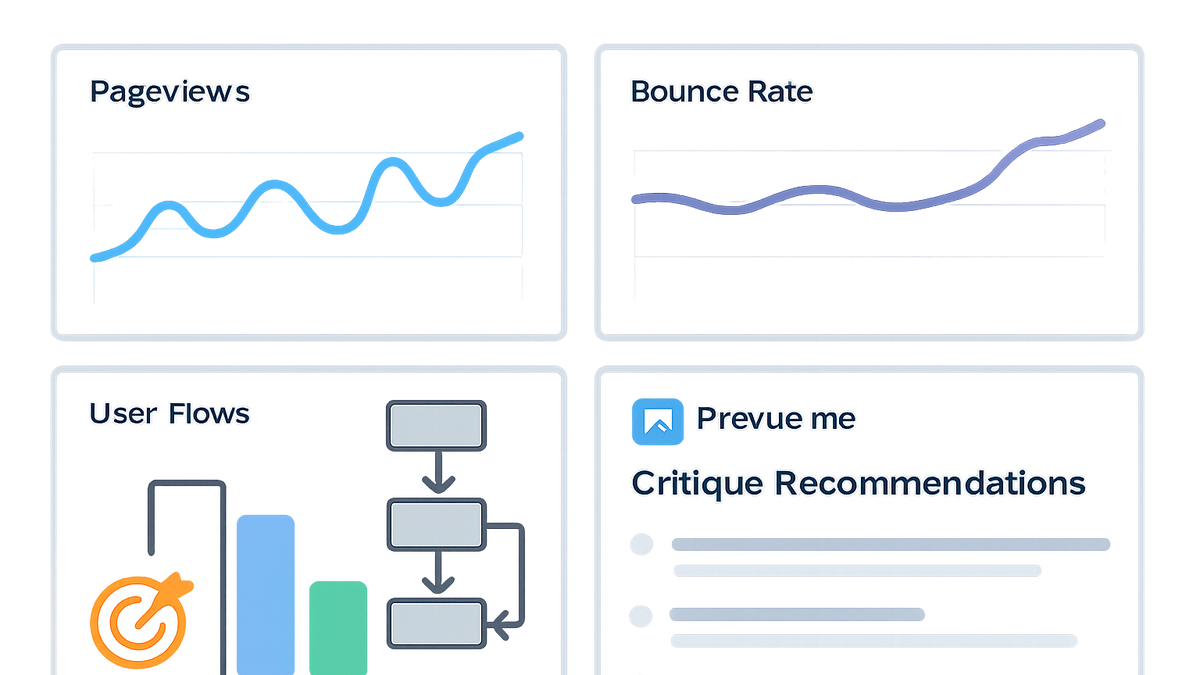
Web Analytics refers to the collection, measurement, and analysis of data generated by visitors navigating a website. It provides deep insights into user behavior, traffic sources, and engagement patterns, enabling teams to optimize conversion rates, enhance user experiences, and refine SEO strategies. By examining metrics such as pageviews, unique visitors, bounce rates, session duration, and conversion rates, businesses can identify friction points within the user journey, test improvements, and validate hypotheses using data-driven methods.
Tools like Google Analytics, Adobe Analytics, and specialized platforms such as Prevue.me integrate CRO, SEO, UX, and accessibility critiques into unified dashboards, offering actionable recommendations. For example, Prevue.me analyzes site structure, content flow, loading performance, and SEO best practices to boost lead generation and user satisfaction.
Implementing Web Analytics typically involves embedding JavaScript tracking snippets or using tag management systems to capture page events, clicks, and custom interactions. Below is an example of a Google Analytics 4 tag snippet:
<script async src="https://www.googletagmanager.com/gtag/js?id=GA_MEASUREMENT_ID"></script>
<script>
  window.dataLayer = window.dataLayer || [];
  function gtag(){dataLayer.push(arguments);}
  gtag('js', new Date());
  gtag('config', 'GA_MEASUREMENT_ID');
</script>
Integrating these analytics solutions empowers teams to make data-driven decisions, iterate quickly, and measure the impact of A/B tests, content changes, and SEO optimizations.
Web analytics
Collection and analysis of website data to improve CRO, UX, and SEO.
Why Web Analytics Matters
Web Analytics underpins effective decision-making by revealing how users interact with your site. It helps in identifying bottlenecks, measuring the success of design changes, and prioritizing optimization efforts across CRO, UX, and SEO disciplines.
-
Enhancing conversion rate optimization (cro)
By tracking and analyzing user flows and drop-off points, teams can optimize page elements and funnels to increase lead generation and sales.
- Funnel analysis:
Identify where users abandon key conversion paths and implement targeted tests to improve completion rates.
- Funnel analysis:
-
Improving user experience (ux)
Behavioral data uncovers pain points such as confusing navigation or slow-loading pages, guiding UX improvements.
- Session recordings:
Review real user sessions to observe interaction patterns and usability issues firsthand.
- Session recordings:
-
Driving seo strategies
Traffic source and landing page performance metrics inform keyword targeting, content optimization, and link-building efforts.
- Referral analysis:
Understand external sources driving traffic and prioritize partnerships or outreach.
- Referral analysis:
Key Metrics in Web Analytics
Understanding and monitoring the right metrics is crucial for evaluating site performance and user engagement.
-
Pageviews
Total number of pages viewed, including repeated views of a single page.
- Definition:
Counts every page load, providing a raw view of traffic volume.
- Application:
Used to gauge overall engagement and content popularity.
- Definition:
-
Unique visitors
Number of distinct individuals visiting the site within a given timeframe.
- Definition:
Identifies separate users based on cookies or device IDs.
- Application:
Measures the reach and growth of the audience over time.
- Definition:
-
Bounce rate
Percentage of single-page sessions where users leave without interaction.
- Definition:
Sessions with only one pageview and no further actions.
- Application:
High bounce rates can indicate irrelevant content or poor UX.
- Definition:
-
Session duration
Average length of user sessions on the site.
- Definition:
Total time users spend interacting with the site per session.
- Application:
Longer durations often correlate with higher engagement.
- Definition:
-
Conversion rate
Ratio of visitors completing a desired action to total visitors.
- Definition:
Conversions divided by total sessions, expressed as a percentage.
- Application:
Tracks the effectiveness of CRO and marketing campaigns.
- Definition:
Implementing Web Analytics: Tools and Best Practices
Proper setup and configuration ensure accurate data collection and actionable insights.
-
Tag implementation
Deploy tracking tags either directly in your site’s HTML or through a tag manager to capture data consistently.
- Manual embedding:
Add tracking snippets in the <head> section of each page for direct control.
- Tag management:
Use tools like Google Tag Manager to manage tags centrally without code changes.
- Manual embedding:
-
Event tracking configuration
Set up custom events to measure key user interactions beyond page loads, such as button clicks and form submissions.
- Click events:
Track clicks on CTAs to assess engagement and optimize placement.
- Form tracking:
Monitor form starts and submissions to identify drop-offs in lead capture.
- Click events:
-
Goal and funnel setup
Define clear goals and conversion funnels to measure success and identify where users exit the process.
- Destination goals:
Track when users reach specific URLs like thank-you pages.
- Multi-step funnels:
Visualize step-by-step user journeys to spot high-friction stages.
- Destination goals:
-
Using prevue.me for automated critiques
Leverage prevue.me to receive automated, actionable critiques covering CRO, UX, SEO, and accessibility in one report.
- Accessibility insights:
Identify and fix WCAG violations to improve inclusivity and SEO.
- Lead generation tips:
Implement form and layout recommendations to maximize sign-ups and conversions.
- Accessibility insights:
-
Data validation and quality assurance
Regularly audit your analytics setup to ensure data accuracy and consistency across platforms.
- Real-time debugging:
Use browser extensions or analytics debug views to validate event firing.
- Cross-device testing:
Confirm data consistency between desktop and mobile implementations.
- Real-time debugging:
Leveraging Web Analytics Insights
Transform raw data into strategic initiatives that drive continuous improvement.
-
A/b testing and experimentation
Use analytics data to design and analyze experiments that test changes to page elements and user flows.
- Hypothesis building:
Formulate clear hypotheses based on analytics trends.
- Result interpretation:
Evaluate statistical significance and lift in conversion metrics.
- Hypothesis building:
-
User journey analysis
Map the paths users take through your site to optimize navigation and content hierarchy.
- Behavior flow:
Visualize common user paths and drop-off points.
- Segmentation:
Analyze how different user segments navigate and convert.
- Behavior flow:
-
Seo optimization
Align analytics insights with SEO goals to improve organic visibility and traffic quality.
- Landing page audits:
Assess and optimize top-entry pages for relevance and performance.
- Keyword analysis:
Track search term performance and adjust content strategy accordingly.
- Landing page audits:
-
Accessibility improvements
Use analytics and tools like prevue.me to detect and address accessibility barriers, improving UX and compliance.
- Wcag checks:
Monitor and remedy violations to enhance usability for all users.
- Screen reader testing:
Analyze how assistive technologies interpret your site.
- Wcag checks: